An histogram is a type of plot where the axis is divided in bins, and values that fall in the same bin are stacked together.
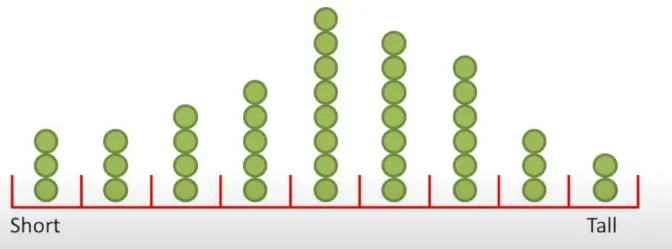
We can take an histogram to compute the probability of a certain measurement. For example the measurements in the middle are more probable than the one at the edges. If the data looks like a certain distribution, we can approximate it with that distribution for further measurements. For instance, the plot in the figure can be approximated with a normal distribution.
Choosing the number of bins is not that easy, since too many bins can make the plot too flat and too detailed, while too few bins can make the plot not enough detailed.
statistics resources: